State Choices to Increase and Supplement Wages
| State minimum wage is above the federal rate ($7.25)1 | | No |
| Indexed to inflation2 | | Not applicable |
| Refundable credit available3 | | No state credit |
| Percent of federal EITC3 | | No state credit |
State Choices to Reduce Tax Burdens
| Income tax threshold for single-parent family of 34 | | No state income tax |
| Income tax threshold for two-parent family of 44 | | No state income tax |
| Income tax burden for single-parent family of 3 at 100% FPL4 | | No state income tax |
| Income tax burden for two-parent family of 4 at 100% FPL4 | | No state income tax |
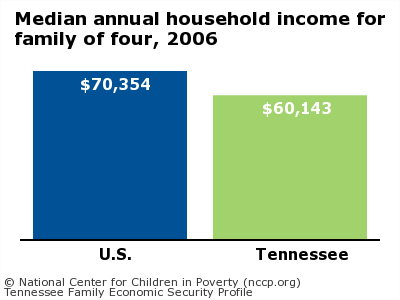
Median annual household income for family of four, 20065
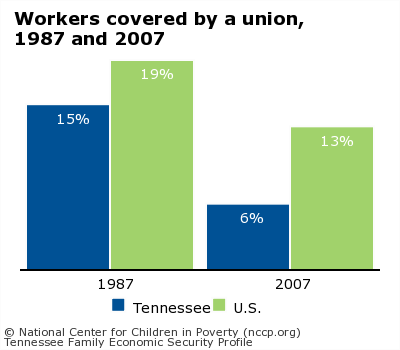
Workers covered by a union,
1987 and 20076
State Choices to Promote Access to Paid Leave
| State provisions for paid leave7 | | None |
State Choices to Promote Adequate Benefits for the Under- and Unemployed
| Minimum weekly benefit (no dependents)8 | | $30/week |
| Additional dependent allowance provided8 | | No |
| Weekly benefit amount is indexed to average weekly wage9 | | No |
| Potential duration of benefits10 | | 13 - 26 weeks |
| Legal immigrants eligible for state-funded benefits when barred from federal11 | | No |
| Annual maximum benefit for family of 312 | | $2,220/year |
| Treatment of child support income13 | | State passes through and disregards some or all support for purposes of fill-the-gap budgeting. |
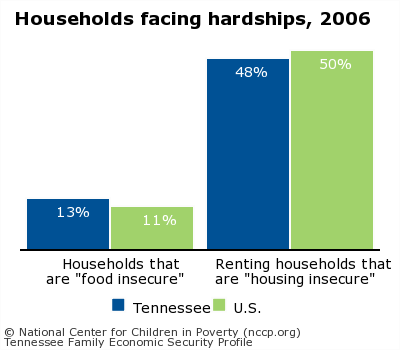
Households facing hardships, 200614
Data Notes and Sources
Data were compiled from 50-state sources. Some state policy decisions may have changed since these data were collected.
- This is the minimum wage rate that applies to non-supervisory, non-farm, private sector employment as of July 2008.
U.S. Department of Labor, Employment Standards Administration. 2011. Minimum Wage Laws in the States, January 2011. http://www.dol.gov (accessed March 17, 2011).
- U.S. Department of Labor, Employment Standards Administration. 2011. Minimum Wage Laws in the States, January 2011. http://www.dol.gov (accessed March 17, 2011).
- State EITC Online Resource Center, http://www.stateeitc.com (accessed June 3, 2009); with additional information from NCCP.
- Calculations include income tax credits that are available to all low-income families in the state, such as state earned income tax credits.
Jason A. Levitis and Andrew C. Nicholas, The Impact of State Income Taxes on Low-Income Families in 2007, Center on Budget and Policy Priorities, 2008. Available at: http://www.cbpp.org (Accessed March 19, 2009).
- U.S. Department of Health and Human Services, Administration for Children and Families, "State Median Income," http://www.acf.hhs.gov (accessed March 13, 2008).
- Percent of employed workers who are covered by a collective bargaining agreement.
Union Membership and Coverage Database, "Union Membership, Coverage, Density, and Employment, 1983-2007," www.unionstats.org (accessed March 5, 2008).
- These reflect provisions for private sector employees; more generous rules may apply for the public sector.
National Conference of State Legislatures, "State Family and Medical Leave Laws" (including external links to individual state statutes), 2006, http://www.ncsl.org with additional information from National Partnership for Women and Families, "Expecting Better: A State-by-State Analysis of Parental Leave Programs," 2005, http://www.nationalpartnership.org (accessed October 1, 2007); with additional information from NCCP.
- U.S. Department of Labor, Office of Workforce Security, Comparison of State UI Laws, 2006, http://www.ows.doleta.gov (accessed July 11, 2007).
- Andrew Stettner, Rebecca Smith, and Rick McHugh, Changing Workforce, Changing Economy: State Unemployment Insurance Reforms for the 21st Century, National Employment Law Project, 2004.
- Potential duration is the maximum number of weeks of benefits that a claimant is eligible for under the regular state program. In most states, it is determined based on the amount and distribution of the recipient's earnings in the base period; eight states have a uniform potential duration for all claimants.
U.S. Department of Labor, Office of Workforce Security, Comparison of State UI Laws, 2006, http://www.ows.doleta.gov (accessed July 11, 2007).
- Adult lawful permanent residents (LPRs) are generally barred from federal benefits during their first 5 years as LPRs. Exceptions include refugees and U.S. veterans (and their families). See data source for more details.
National Immigration Law Center, Guide to Immigrant Eligibility for Federal Programs, Fourth Edition, 2002; with updates from Update Page, http://www.nilc.org (accessed October 28, 2005).
- Gretchen Rowe with Jeffrey Versteeg, The Welfare Rules Databook: State Policies as of July 2005, Assessing the New Federalism, The Urban Institute, 2006.
- A child support pass-through is the amount of collected child support that the state gives to families on whose behalf the child support was collected. A child support disregard is the amount of child support that the family can keep without lowering their TANF benefits.
Jan Justice, State Policy Re Pass-Through and Disregard of Current Month's Child Support Collected for Families Receiving TANF-Funded Cash Assistance, Center for Law and Social Policy, 2007.
- Food Insecurity:
Figure reflects the percent of households forced to reduce food intake, disrupt normal eating patterns, or go hungry because they lack the money or resources to obtain adequate food.
Mark Nord, Margaret Andrews, and Steven Carlson, Household Food Security in the United States, 2006, Economic Research Service, United States Department of Agriculture, 2007, http://www.ers.usda.gov (accessed March 14, 2008).
Housing Insecurity:
Figure reflects the percent of families living in rental units who pay 30 percent or more of their income on housing.
U.S. Census Bureau, "American Community Survey Custom Tables, 2006: Gross Rent as a Percentage of Household Income in the Past 12 Months," http://factfinder.census.gov (accessed March 14, 2008).