| Overview | Health |
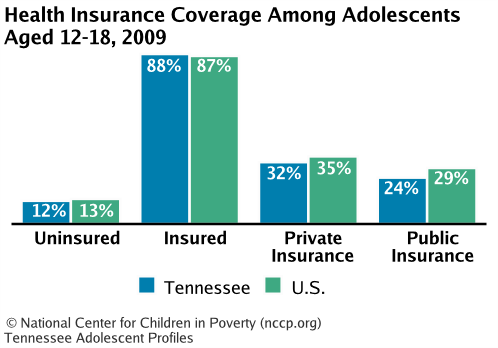
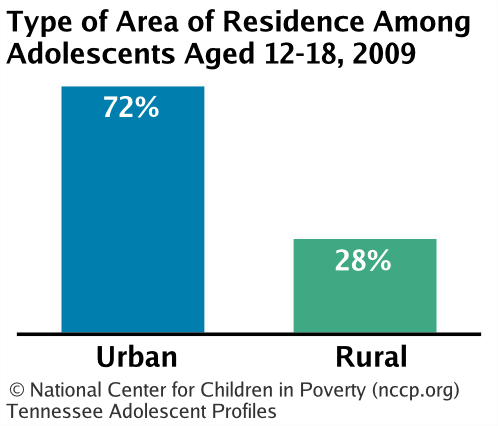
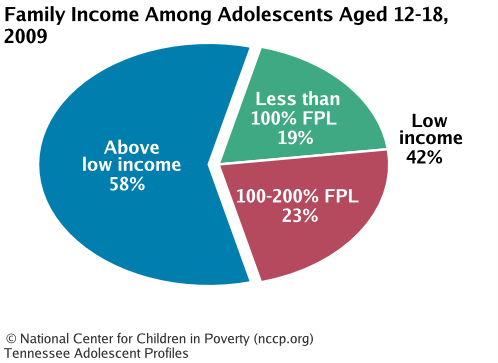
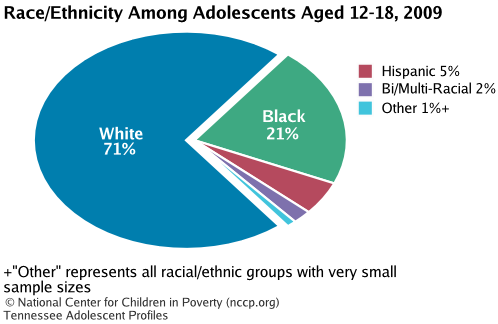
Although adolescence is generally perceived as a period of good health, many in this age group face poor health outcomes and establish unhealthy behaviors that follow them into adulthood. An adolescent's ability to successfully navigate the transition to adulthood is influenced not only by behaviors and exposure to risk but also by demographic characteristics such as race/ethnicity, geography, family income, and health insurance status, among others. State policies that promote access to high quality services for all adolescents can mitigate the effects of some of these factors and help ensure that adolescents enter adulthood healthy, independent, and ready to thrive. This state profile provides data on Tennessee's 564,806 adolescents age 12 to 18 and highlights state policy choices in health, mental health, violence and injury prevention, and youth development that improve access to and quality of services and promote the health and well-being of this age group.
| Health |
Data Notes and Sources
Last Updated: June 1, 2011
These state profiles are part of the Improving the Odds for Adolescents project, which is supported by a generous grant from The Atlantic Philanthropies. Contact us with questions or to update your state profile.
- State data were calculated from the Annual Social and Economic Supplement (the March supplement) of the Current Population Survey from 2007, 2008, and 2009, representing information from calendar years 2006, 2007, and 2008. NCCP averaged three years of data because of small sample sizes in less populated states. The national data were calculated from the 2009 data, representing information from the previous calendar year.
- Race/ethnicity estimates were excluded if the unweighted sample size in the denominator was less than 50.
State data were calculated from the Annual Social and Economic Supplement (the March supplement) of the Current Population Survey from 2007, 2008, and 2009, representing information from calendar years 2006, 2007, and 2008. NCCP averaged three years of data because of small sample sizes in less populated states. The national data were calculated from the 2009 data, representing information from the previous calendar year.